Western Gerygone
Gerygone fusca
ABR description
The following is extracted from the Annual Bird Report for the twelve months to June 2017.
Common, breeding summer migrant
Found in drier woodland with a scrubby understory.
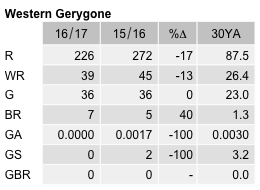
General: Observed mainly in spring (53%) and summer (34%), lower in autumn (10%) and winter (2%). Reporting rate 1.6% down on last year (2.3%) and lower than the 10YA (2.7%) and the 30YA (3.2%). Abundance (0.0276) lower than last year (0.0423) the 10YA and the 30YA. Mean 1.7, median 1, max 6/11 Sep MFNR (LaK1). 7 breeding records – like last year, an unusually high number – from 4 locations from nb/29 Oct Newline Paddocks (DaG2) to dy/20 Feb NNPVIC (SmA1).
GBS: No records this year. 3 records last year. Continues pattern of lower garden records in past 2 decades compared to higher numbers in first decade of GBS. No breeding records ever recorded in GBS.
Abundance
Abundance is the average number of birds of that species per survey. Where the species was observed (presence recorded) but the number of birds seen was not recorded, this is treated as a count of zero.
Abundance by year
This chart shows the abundance of Western Gerygone between 1982 and 2017. 
Abundance by month
This chart shows the monthly abundance of Western Gerygone. The blue lines show the abundance for the twelve months to June 2017 and the bars show the average abundance for the period 1982 to 2017. 
Abundance by season
This chart shows the seasonal abundance of Western Gerygone. The blue lines show the seasonal abundance for the twelve months to June 2017 and the bars show the average seasonal abundance for the period 1982 to 2017. 
Abundance data
| Month | Season | ||||||||||||||||||
|---|---|---|---|---|---|---|---|---|---|---|---|---|---|---|---|---|---|---|---|
| Period | Jul | Aug | Sep | Oct | Nov | Dec | Jan | Feb | Mar | Apr | May | Jun | Winter | Spring | Summer | Autumn | All | ||
| All years | |||||||||||||||||||
| All | 0.0 | 0.0 | 0.1 | 0.1 | 0.1 | 0.1 | 0.0 | 0.0 | 0.0 | 0.0 | 0.0 | 0.0 | 0.0 | 0.1 | 0.0 | 0.0 | 0.0 | ||
| Previous years | |||||||||||||||||||
| All previous years | 0.0 | 0.0 | 0.1 | 0.1 | 0.1 | 0.1 | 0.0 | 0.0 | 0.0 | 0.0 | 0.0 | 0.0 | 0.0 | 0.1 | 0.1 | 0.0 | 0.0 | ||
| Previous 30 years | 0.0 | 0.0 | 0.1 | 0.1 | 0.1 | 0.1 | 0.0 | 0.0 | 0.1 | 0.0 | 0.0 | 0.0 | 0.0 | 0.1 | 0.1 | 0.0 | 0.0 | ||
| Previous 20 years | 0.0 | 0.0 | 0.1 | 0.1 | 0.1 | 0.1 | 0.0 | 0.0 | 0.1 | 0.0 | 0.0 | 0.0 | 0.0 | 0.1 | 0.0 | 0.0 | 0.0 | ||
| 10 year groups | |||||||||||||||||||
| [2007,2017) | 0.0 | 0.0 | 0.1 | 0.1 | 0.1 | 0.1 | 0.0 | 0.0 | 0.1 | 0.0 | 0.0 | 0.0 | 0.0 | 0.1 | 0.0 | 0.0 | 0.0 | ||
| [1997,2007) | 0.0 | 0.0 | 0.1 | 0.0 | 0.1 | 0.1 | 0.0 | 0.0 | 0.1 | 0.0 | 0.0 | 0.0 | 0.0 | 0.1 | 0.1 | 0.0 | 0.1 | ||
| [1987,1997) | 0.0 | 0.0 | 0.1 | 0.1 | 0.1 | 0.1 | 0.1 | 0.0 | 0.0 | 0.0 | 0.0 | 0.0 | 0.0 | 0.1 | 0.1 | 0.0 | 0.1 | ||
| 5 year groups | |||||||||||||||||||
| [2012,2017) | 0.0 | 0.0 | 0.1 | 0.1 | 0.1 | 0.1 | 0.0 | 0.0 | 0.1 | 0.0 | 0.0 | 0.0 | 0.0 | 0.1 | 0.0 | 0.0 | 0.0 | ||
| [2007,2012) | 0.0 | 0.0 | 0.1 | 0.1 | 0.1 | 0.1 | 0.0 | 0.0 | 0.0 | 0.0 | 0.0 | 0.0 | 0.0 | 0.1 | 0.0 | 0.0 | 0.1 | ||
| [2002,2007) | 0.0 | 0.0 | 0.1 | 0.0 | 0.1 | 0.1 | 0.0 | 0.0 | 0.1 | 0.0 | 0.0 | 0.0 | 0.0 | 0.1 | 0.1 | 0.0 | 0.0 | ||
| [1997,2002) | 0.0 | 0.0 | 0.1 | 0.1 | 0.1 | 0.1 | 0.0 | 0.0 | 0.0 | 0.0 | 0.0 | 0.0 | 0.0 | 0.1 | 0.1 | 0.0 | 0.1 | ||
| [1992,1997) | 0.0 | 0.0 | 0.1 | 0.2 | 0.1 | 0.2 | 0.0 | 0.0 | 0.0 | 0.0 | 0.0 | 0.0 | 0.0 | 0.1 | 0.1 | 0.0 | 0.1 | ||
| [1987,1992) | 0.0 | 0.0 | 0.0 | 0.1 | 0.1 | 0.1 | 0.1 | 0.0 | 0.1 | 0.0 | 0.0 | 0.0 | 0.0 | 0.1 | 0.1 | 0.0 | 0.0 | ||
| Year | |||||||||||||||||||
| 2017 | 0.0 | 0.0 | 0.1 | 0.1 | 0.0 | 0.1 | 0.0 | 0.0 | 0.0 | 0.0 | 0.0 | 0.0 | 0.0 | 0.1 | 0.0 | 0.0 | 0.0 | ||
| 2016 | 0.0 | 0.0 | 0.1 | 0.1 | 0.1 | 0.1 | 0.0 | 0.0 | 0.1 | 0.0 | 0.0 | 0.0 | 0.0 | 0.1 | 0.0 | 0.0 | 0.0 | ||
| 2015 | 0.0 | 0.0 | 0.1 | 0.2 | 0.1 | 0.1 | 0.1 | 0.0 | 0.1 | 0.0 | 0.0 | 0.0 | 0.0 | 0.1 | 0.1 | 0.0 | 0.1 | ||
| 2014 | 0.0 | 0.0 | 0.1 | 0.1 | 0.1 | 0.1 | 0.0 | 0.1 | 0.1 | 0.1 | 0.0 | 0.0 | 0.0 | 0.1 | 0.0 | 0.1 | 0.0 | ||
| 2013 | 0.0 | 0.0 | 0.0 | 0.1 | 0.2 | 0.1 | 0.0 | 0.0 | 0.0 | 0.0 | 0.0 | 0.0 | 0.0 | 0.1 | 0.1 | 0.0 | 0.0 | ||
| 2012 | 0.0 | 0.0 | 0.0 | 0.0 | 0.0 | 0.0 | 0.0 | 0.0 | 0.0 | 0.0 | 0.0 | 0.0 | 0.0 | 0.0 | 0.0 | 0.0 | 0.0 | ||
| 2011 | 0.0 | 0.0 | 0.1 | 0.1 | 0.1 | 0.0 | 0.0 | 0.0 | 0.0 | 0.0 | 0.0 | 0.0 | 0.0 | 0.1 | 0.0 | 0.0 | 0.0 | ||
| 2010 | 0.0 | 0.0 | 0.1 | 0.1 | 0.1 | 0.1 | 0.0 | 0.0 | 0.0 | 0.0 | 0.0 | 0.0 | 0.0 | 0.1 | 0.0 | 0.0 | 0.1 | ||
| 2009 | 0.0 | 0.0 | 0.1 | 0.1 | 0.1 | 0.0 | 0.1 | 0.0 | 0.0 | 0.0 | 0.0 | 0.0 | 0.0 | 0.1 | 0.0 | 0.0 | 0.1 | ||
| 2008 | 0.0 | 0.0 | 0.2 | 0.1 | 0.1 | 0.1 | 0.1 | 0.0 | 0.1 | 0.0 | 0.0 | 0.0 | 0.0 | 0.1 | 0.1 | 0.0 | 0.1 | ||
| 2007 | 0.0 | 0.0 | 0.1 | 0.1 | 0.1 | 0.1 | 0.0 | 0.1 | 0.0 | 0.0 | 0.0 | 0.0 | 0.0 | 0.1 | 0.1 | 0.0 | 0.0 | ||
| 2006 | 0.0 | 0.0 | 0.1 | 0.1 | 0.2 | 0.1 | 0.0 | 0.0 | 0.1 | 0.0 | 0.0 | 0.0 | 0.0 | 0.1 | 0.1 | 0.0 | 0.1 | ||
| 2005 | 0.0 | 0.0 | 0.2 | 0.0 | 0.0 | 0.2 | 0.0 | 0.0 | 0.1 | 0.0 | 0.0 | 0.0 | 0.0 | 0.1 | 0.1 | 0.0 | 0.1 | ||
| 2004 | 0.0 | 0.0 | 0.2 | 0.0 | 0.1 | 0.0 | 0.0 | 0.0 | 0.1 | 0.0 | 0.0 | 0.0 | 0.0 | 0.1 | 0.0 | 0.0 | 0.0 | ||
| 2003 | 0.0 | 0.0 | 0.1 | 0.0 | 0.2 | 0.1 | 0.0 | 0.0 | 0.0 | 0.0 | 0.0 | 0.0 | 0.0 | 0.1 | 0.0 | 0.0 | 0.0 | ||
| 2002 | 0.0 | 0.0 | 0.1 | 0.0 | 0.0 | 0.1 | 0.0 | 0.0 | 0.1 | 0.0 | 0.0 | 0.0 | 0.0 | 0.0 | 0.0 | 0.1 | 0.0 | ||
| 2001 | 0.0 | 0.0 | 0.1 | 0.0 | 0.0 | 0.2 | 0.0 | 0.0 | 0.0 | 0.0 | 0.0 | 0.0 | 0.0 | 0.1 | 0.1 | 0.0 | 0.0 | ||
| 2000 | 0.0 | 0.0 | 0.1 | 0.1 | 0.1 | 0.1 | 0.0 | 0.0 | 0.0 | 0.0 | 0.0 | 0.0 | 0.0 | 0.1 | 0.0 | 0.0 | 0.0 | ||
| 1999 | 0.0 | 0.0 | 0.2 | 0.0 | 0.2 | 0.1 | 0.1 | 0.1 | 0.1 | 0.0 | 0.0 | 0.0 | 0.0 | 0.1 | 0.1 | 0.0 | 0.1 | ||
| 1998 | 0.0 | 0.0 | 0.3 | 0.1 | 0.2 | 0.2 | 0.1 | 0.1 | 0.0 | 0.0 | 0.0 | 0.0 | 0.0 | 0.2 | 0.1 | 0.0 | 0.1 | ||
| 1997 | 0.0 | 0.0 | 0.1 | 0.1 | 0.2 | 0.0 | 0.0 | 0.0 | 0.0 | 0.0 | 0.0 | 0.0 | 0.0 | 0.1 | 0.0 | 0.0 | 0.1 | ||
| 1996 | 0.0 | 0.2 | 0.4 | 0.4 | 0.3 | 0.3 | 0.0 | 0.0 | 0.1 | 0.0 | 0.0 | 0.0 | 0.1 | 0.4 | 0.1 | 0.0 | 0.1 | ||
| 1995 | 0.0 | 0.0 | 0.0 | 0.0 | 0.1 | 0.1 | 0.1 | 0.0 | 0.0 | 0.0 | 0.0 | 0.0 | 0.0 | 0.0 | 0.1 | 0.0 | 0.0 | ||
| 1994 | 0.0 | 0.0 | 0.0 | 0.1 | 0.1 | 0.5 | 0.1 | 0.0 | 0.0 | 0.0 | 0.0 | 0.0 | 0.0 | 0.1 | 0.2 | 0.0 | 0.0 | ||
| 1993 | 0.0 | 0.0 | 0.0 | 0.1 | 0.2 | 0.3 | 0.1 | 0.0 | 0.0 | 0.0 | 0.0 | 0.0 | 0.0 | 0.1 | 0.1 | 0.0 | 0.1 | ||
| 1992 | 0.0 | 0.0 | 0.0 | 0.4 | 0.1 | 0.1 | 0.0 | 0.1 | 0.1 | 0.0 | 0.0 | 0.0 | 0.0 | 0.2 | 0.0 | 0.0 | 0.1 | ||
| 1991 | 0.0 | 0.0 | 0.1 | 0.2 | 0.0 | 0.2 | 0.1 | 0.0 | 0.0 | 0.0 | 0.0 | 0.0 | 0.0 | 0.1 | 0.1 | 0.0 | 0.1 | ||
| 1990 | 0.0 | 0.0 | 0.0 | 0.1 | 0.1 | 0.1 | 0.1 | 0.0 | 0.1 | 0.1 | 0.0 | 0.0 | 0.0 | 0.1 | 0.1 | 0.1 | 0.0 | ||
| 1989 | 0.0 | 0.0 | 0.1 | 0.1 | 0.1 | 0.1 | 0.1 | 0.0 | 0.1 | 0.0 | 0.0 | 0.0 | 0.0 | 0.1 | 0.1 | 0.0 | 0.0 | ||
| 1988 | 0.0 | 0.0 | 0.1 | 0.0 | 0.1 | 0.1 | 0.0 | 0.0 | 0.0 | 0.0 | 0.0 | 0.0 | 0.0 | 0.1 | 0.0 | 0.0 | 0.0 | ||
| 1987 | 0.0 | 0.0 | 0.0 | 0.1 | 0.1 | 0.0 | 0.0 | 0.0 | 0.1 | 0.0 | 0.0 | 0.0 | 0.0 | 0.1 | 0.0 | 0.0 | 0.0 | ||
| 1986 | 0.0 | 0.0 | 0.1 | 0.1 | 0.1 | 0.1 | 0.0 | 0.0 | 0.0 | 0.0 | 0.0 | 0.0 | 0.0 | 0.1 | 0.0 | 0.0 | 0.0 | ||
| 1985 | 0.0 | 0.0 | 0.0 | 0.0 | 0.0 | 0.0 | 0.0 | 0.1 | 0.0 | 0.0 | 0.0 | 0.0 | 0.0 | 0.0 | 0.0 | 0.0 | 0.0 | ||
| 1984 | 0.0 | 0.0 | 0.0 | 0.0 | 0.0 | 0.0 | 0.0 | 0.0 | 0.0 | 0.0 | 0.0 | 0.0 | 0.0 | 0.0 | 0.0 | 0.0 | 0.0 | ||
| 1983 | 0.0 | 0.0 | 0.0 | 0.0 | 0.0 | 0.0 | 0.0 | 0.0 | 0.0 | - | 0.0 | 0.0 | 0.0 | 0.0 | 0.0 | 0.0 | 0.0 | ||
| 1982 | - | 0.0 | - | 0.0 | 0.0 | 0.0 | - | 0.0 | - | 0.0 | - | 0.0 | 0.0 | 0.0 | 0.0 | 0.0 | 0.0 | ||
Reporting rates
Reporting rate is the proportion of all surveys in which the species was present.
Reporting rate by year
This chart shows the reporting rate of Western Gerygone each year between 1982 and 2017. 
Reporting rate by month
This chart shows the reporting rate by month of Western Gerygone. The blue lines show the reporting rate for the twelve months to June 2017 and the bars show the average reporting rate for the period 1982 to 2017. 
Reporting rate by season
This chart shows the seasonal reporting rate of Western Gerygone. The blue lines show the seasonal reporting rate for the twelve months to June 2017 and the bars show the average seasonal reporting rate for the period 1982 to 2017. 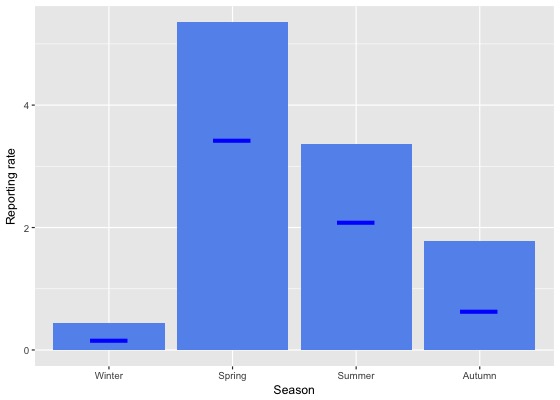
Reporting rate data
| Month | Season | ||||||||||||||||||
|---|---|---|---|---|---|---|---|---|---|---|---|---|---|---|---|---|---|---|---|
| Period | Jul | Aug | Sep | Oct | Nov | Dec | Jan | Feb | Mar | Apr | May | Jun | Winter | Spring | Summer | Autumn | All | ||
| All years | |||||||||||||||||||
| All | 0.2 | 0.8 | 6.2 | 4.6 | 5.5 | 5.2 | 2.8 | 1.9 | 3.3 | 1.3 | 0.2 | 0.3 | 0.4 | 5.3 | 3.4 | 1.8 | 3.0 | ||
| Previous years | |||||||||||||||||||
| All previous years | 0.2 | 0.8 | 6.5 | 4.8 | 5.9 | 5.5 | 3.0 | 2.0 | 3.7 | 1.4 | 0.3 | 0.4 | 0.5 | 5.6 | 3.6 | 2.0 | 3.2 | ||
| Previous 30 years | 0.2 | 0.8 | 6.6 | 4.8 | 6.0 | 5.5 | 3.0 | 2.0 | 3.7 | 1.4 | 0.3 | 0.4 | 0.5 | 5.7 | 3.6 | 2.0 | 3.2 | ||
| Previous 20 years | 0.2 | 0.6 | 6.8 | 4.5 | 5.7 | 5.4 | 2.7 | 1.8 | 3.6 | 1.3 | 0.3 | 0.4 | 0.4 | 5.5 | 3.4 | 1.9 | 3.1 | ||
| 10 year groups | |||||||||||||||||||
| [2007,2017) | 0.1 | 0.6 | 5.1 | 4.6 | 4.6 | 4.3 | 2.7 | 1.6 | 3.3 | 1.4 | 0.2 | 0.3 | 0.3 | 4.8 | 2.9 | 1.8 | 2.7 | ||
| [1997,2007) | 0.3 | 0.6 | 10.3 | 4.0 | 7.9 | 7.5 | 2.8 | 2.4 | 4.1 | 1.0 | 0.4 | 0.6 | 0.5 | 7.4 | 4.8 | 2.2 | 4.0 | ||
| [1987,1997) | 0.3 | 1.6 | 5.2 | 6.7 | 7.0 | 6.4 | 4.8 | 2.6 | 4.6 | 1.9 | 0.5 | 0.5 | 0.8 | 6.4 | 4.7 | 2.4 | 3.7 | ||
| 5 year groups | |||||||||||||||||||
| [2012,2017) | 0.1 | 0.5 | 3.4 | 4.5 | 4.2 | 3.8 | 2.5 | 1.5 | 3.6 | 1.1 | 0.3 | 0.2 | 0.3 | 4.1 | 2.6 | 1.9 | 2.4 | ||
| [2007,2012) | 0.2 | 0.7 | 8.9 | 5.0 | 5.7 | 5.3 | 3.3 | 2.0 | 2.3 | 2.1 | 0.0 | 0.6 | 0.5 | 6.2 | 3.9 | 1.7 | 3.5 | ||
| [2002,2007) | 0.2 | 0.3 | 10.0 | 3.7 | 7.4 | 6.6 | 2.1 | 1.2 | 4.8 | 1.1 | 0.5 | 0.6 | 0.4 | 7.0 | 3.9 | 2.5 | 3.7 | ||
| [1997,2002) | 0.4 | 0.9 | 10.7 | 4.4 | 8.4 | 8.7 | 3.6 | 3.7 | 3.2 | 0.9 | 0.4 | 0.5 | 0.6 | 8.0 | 5.7 | 1.7 | 4.3 | ||
| [1992,1997) | 0.0 | 1.9 | 6.6 | 5.8 | 7.9 | 8.2 | 2.6 | 2.5 | 3.0 | 0.2 | 0.3 | 0.5 | 0.9 | 6.8 | 4.5 | 1.2 | 3.4 | ||
| [1987,1992) | 0.4 | 1.5 | 4.6 | 7.2 | 6.5 | 5.6 | 6.1 | 2.6 | 5.5 | 2.9 | 0.6 | 0.4 | 0.8 | 6.2 | 4.8 | 3.0 | 3.9 | ||
| Year | |||||||||||||||||||
| 2017 | 0.0 | 0.5 | 3.7 | 3.7 | 2.9 | 3.2 | 1.8 | 1.4 | 1.4 | 0.3 | 0.0 | 0.0 | 0.2 | 3.4 | 2.1 | 0.6 | 1.6 | ||
| 2016 | 0.2 | 0.6 | 3.7 | 4.8 | 4.5 | 3.5 | 2.4 | 1.1 | 3.8 | 1.0 | 0.2 | 0.0 | 0.3 | 4.4 | 2.2 | 1.8 | 2.3 | ||
| 2015 | 0.2 | 0.4 | 3.6 | 6.1 | 3.7 | 2.8 | 2.8 | 1.4 | 3.5 | 1.1 | 0.5 | 0.4 | 0.4 | 4.6 | 2.4 | 1.8 | 2.5 | ||
| 2014 | 0.0 | 0.0 | 6.2 | 3.9 | 3.7 | 5.7 | 1.9 | 2.9 | 5.0 | 3.3 | 0.4 | 0.3 | 0.1 | 4.6 | 2.9 | 3.3 | 3.0 | ||
| 2013 | 0.0 | 0.0 | 1.4 | 4.1 | 7.4 | 4.6 | 4.0 | 1.8 | 3.0 | 0.2 | 0.0 | 0.0 | 0.0 | 4.2 | 3.7 | 1.4 | 2.7 | ||
| 2012 | 0.0 | 1.2 | 2.0 | 2.5 | 1.1 | 3.5 | 2.0 | 1.0 | 2.4 | 0.3 | 0.0 | 0.3 | 0.5 | 2.0 | 2.3 | 1.0 | 1.6 | ||
| 2011 | 0.0 | 0.8 | 7.8 | 6.3 | 4.2 | 2.4 | 4.1 | 1.8 | 0.6 | 0.9 | 0.0 | 0.3 | 0.3 | 6.3 | 2.9 | 0.5 | 2.7 | ||
| 2010 | 0.0 | 0.0 | 9.0 | 5.5 | 4.8 | 4.4 | 1.9 | 0.0 | 2.8 | 1.7 | 0.0 | 1.9 | 1.1 | 6.3 | 2.8 | 1.9 | 3.6 | ||
| 2009 | 0.7 | 0.0 | 9.8 | 5.2 | 6.2 | 3.2 | 3.3 | 0.8 | 3.7 | 1.2 | 0.0 | 0.0 | 0.2 | 6.6 | 2.6 | 1.9 | 3.6 | ||
| 2008 | 0.0 | 1.7 | 10.1 | 3.6 | 4.0 | 6.8 | 3.2 | 2.8 | 4.3 | 3.1 | 0.0 | 0.9 | 0.8 | 5.4 | 4.8 | 2.9 | 3.8 | ||
| 2007 | 0.0 | 0.9 | 7.5 | 4.5 | 9.5 | 9.7 | 3.1 | 4.3 | 1.3 | 3.8 | 0.0 | 0.0 | 0.2 | 6.3 | 6.3 | 2.0 | 4.1 | ||
| 2006 | 0.7 | 1.9 | 10.6 | 6.4 | 8.3 | 6.1 | 2.8 | 3.0 | 5.6 | 1.6 | 0.0 | 0.4 | 0.8 | 8.0 | 4.1 | 3.3 | 4.4 | ||
| 2005 | 0.7 | 0.0 | 12.6 | 1.1 | 3.4 | 9.6 | 3.5 | 2.2 | 5.2 | 1.1 | 1.0 | 1.5 | 1.0 | 6.9 | 6.4 | 2.6 | 4.2 | ||
| 2004 | 0.0 | 0.0 | 10.6 | 2.3 | 7.6 | 1.8 | 1.2 | 1.0 | 5.2 | 1.6 | 1.0 | 0.6 | 0.2 | 7.1 | 1.5 | 2.9 | 2.9 | ||
| 2003 | 0.0 | 0.0 | 8.1 | 3.1 | 14.2 | 9.7 | 1.5 | 0.5 | 1.8 | 0.5 | 0.0 | 0.0 | 0.0 | 8.7 | 4.7 | 0.9 | 4.0 | ||
| 2002 | 0.0 | 0.0 | 7.5 | 2.6 | 2.0 | 5.6 | 1.3 | 0.0 | 5.9 | 0.6 | 0.0 | 0.0 | 0.0 | 3.9 | 3.2 | 3.0 | 2.7 | ||
| 2001 | 0.0 | 0.0 | 7.1 | 2.5 | 3.4 | 13.8 | 2.0 | 2.6 | 2.4 | 0.0 | 0.6 | 0.0 | 0.0 | 4.8 | 7.0 | 1.3 | 3.4 | ||
| 2000 | 1.6 | 2.0 | 10.7 | 5.7 | 5.1 | 6.0 | 2.5 | 3.8 | 2.0 | 0.4 | 0.9 | 0.0 | 1.1 | 7.1 | 4.3 | 1.2 | 3.7 | ||
| 1999 | 0.0 | 0.0 | 14.9 | 3.1 | 12.3 | 5.0 | 7.3 | 4.3 | 6.5 | 1.0 | 0.0 | 1.9 | 1.2 | 10.3 | 5.5 | 2.5 | 5.0 | ||
| 1998 | 0.0 | 1.9 | 15.4 | 7.6 | 13.3 | 12.3 | 5.9 | 5.7 | 3.2 | 0.0 | 0.0 | 0.0 | 0.6 | 12.5 | 8.8 | 1.9 | 7.4 | ||
| 1997 | 0.0 | 1.7 | 10.0 | 5.3 | 12.0 | 4.8 | 2.0 | 3.5 | 2.5 | 3.7 | 0.0 | 0.0 | 0.5 | 9.6 | 3.8 | 2.6 | 4.6 | ||
| 1996 | 0.0 | 5.3 | 21.3 | 10.5 | 16.7 | 16.2 | 1.0 | 2.4 | 5.9 | 0.0 | 0.0 | 1.1 | 2.4 | 15.5 | 6.6 | 2.7 | 7.3 | ||
| 1995 | 0.0 | 0.0 | 3.9 | 0.6 | 2.7 | 2.3 | 4.4 | 1.6 | 3.1 | 0.0 | 1.3 | 1.1 | 0.3 | 2.1 | 3.0 | 1.3 | 1.7 | ||
| 1994 | 0.0 | 1.3 | 2.9 | 5.8 | 3.7 | 6.5 | 2.9 | 0.0 | 0.0 | 0.0 | 0.0 | 0.0 | 0.5 | 4.1 | 2.9 | 0.0 | 1.8 | ||
| 1993 | 0.0 | 1.3 | 3.2 | 6.7 | 12.1 | 8.7 | 4.1 | 3.1 | 1.2 | 1.7 | 0.0 | 0.0 | 0.5 | 7.4 | 5.5 | 0.9 | 3.4 | ||
| 1992 | 0.0 | 1.9 | 2.4 | 8.5 | 6.9 | 4.8 | 0.0 | 7.3 | 4.2 | 0.0 | 0.0 | 0.0 | 0.6 | 6.0 | 3.7 | 1.5 | 3.1 | ||
| 1991 | 0.0 | 0.0 | 5.8 | 9.7 | 3.1 | 9.5 | 5.4 | 0.0 | 4.8 | 3.4 | 0.0 | 0.0 | 0.0 | 6.3 | 5.6 | 2.7 | 3.6 | ||
| 1990 | 1.9 | 2.7 | 4.3 | 6.1 | 5.6 | 5.6 | 11.1 | 1.4 | 8.0 | 4.8 | 0.0 | 0.0 | 1.9 | 5.4 | 6.0 | 4.5 | 4.1 | ||
| 1989 | 0.0 | 2.2 | 6.1 | 8.8 | 7.6 | 6.1 | 8.5 | 4.1 | 6.7 | 3.6 | 1.3 | 1.2 | 1.2 | 7.6 | 6.2 | 4.0 | 4.9 | ||
| 1988 | 0.0 | 0.7 | 6.7 | 4.3 | 6.9 | 5.1 | 3.5 | 3.4 | 3.0 | 1.1 | 0.0 | 0.0 | 0.3 | 5.9 | 4.0 | 1.4 | 2.9 | ||
| 1987 | 0.0 | 0.0 | 1.2 | 7.8 | 6.9 | 4.3 | 4.6 | 1.7 | 6.2 | 2.9 | 0.9 | 0.5 | 0.4 | 5.5 | 3.4 | 3.2 | 3.8 | ||
| 1986 | 0.0 | 2.6 | 3.8 | 5.6 | 8.5 | 5.9 | 0.0 | 2.8 | 0.0 | 3.9 | 0.0 | 0.0 | 1.0 | 5.9 | 3.2 | 1.8 | 3.2 | ||
| 1985 | 0.0 | 0.0 | 0.0 | 1.2 | 1.8 | 0.0 | 0.0 | 5.9 | 0.0 | 0.0 | 0.0 | 0.0 | 0.0 | 1.0 | 1.2 | 0.0 | 0.7 | ||
| 1984 | 0.0 | 0.0 | 0.0 | 0.0 | 0.0 | 0.0 | 0.0 | 0.0 | 0.0 | 0.0 | 0.0 | 0.0 | 0.0 | 0.0 | 0.0 | 0.0 | 0.0 | ||
| 1983 | 0.0 | 0.0 | 0.0 | 0.0 | 0.0 | 0.0 | 0.0 | 0.0 | 0.0 | - | 0.0 | 0.0 | 0.0 | 0.0 | 0.0 | 0.0 | 0.0 | ||
| 1982 | - | 0.0 | - | 0.0 | 0.0 | 0.0 | - | 0.0 | - | 0.0 | - | 0.0 | 0.0 | 0.0 | 0.0 | 0.0 | 0.0 | ||
Breeding data
Breeding records by month
Number of breeding records by breeding code and month, 2017 and all years| Breeding code | Jul | Aug | Sep | Oct | Nov | Dec | Jan | Feb | Mar | Apr | May | Jun |
|---|---|---|---|---|---|---|---|---|---|---|---|---|
| 2017 | ||||||||||||
| Breeding (BLA code) | 0 | 0 | 0 | 0 | 0 | 0 | 0 | 0 | 0 | 0 | 0 | 0 |
| Carrying Food | 0 | 0 | 0 | 0 | 0 | 0 | 0 | 0 | 0 | 0 | 0 | 0 |
| Copulating | 0 | 0 | 0 | 0 | 0 | 0 | 0 | 0 | 0 | 0 | 0 | 0 |
| Display | 0 | 0 | 0 | 0 | 0 | 0 | 0 | 0 | 0 | 0 | 0 | 0 |
| Dependent young | 0 | 0 | 0 | 0 | 0 | 0 | 2 | 2 | 0 | 0 | 0 | 0 |
| Faecal sac | 0 | 0 | 0 | 0 | 0 | 0 | 0 | 0 | 0 | 0 | 0 | 0 |
| Inspecting hollow | 0 | 0 | 0 | 0 | 0 | 0 | 0 | 0 | 0 | 0 | 0 | 0 |
| Nest building | 0 | 0 | 0 | 1 | 0 | 0 | 0 | 0 | 0 | 0 | 0 | 0 |
| Nest with eggs | 0 | 0 | 0 | 0 | 0 | 0 | 0 | 0 | 0 | 0 | 0 | 0 |
| Nest with young | 0 | 0 | 0 | 0 | 0 | 0 | 0 | 0 | 0 | 0 | 0 | 0 |
| On/leaving nest | 0 | 0 | 0 | 1 | 1 | 0 | 0 | 0 | 0 | 0 | 0 | 0 |
| All years | ||||||||||||
| Breeding (BLA code) | 0 | 0 | 0 | 0 | 0 | 0 | 0 | 0 | 0 | 0 | 0 | 0 |
| Carrying Food | 0 | 0 | 1 | 0 | 1 | 0 | 0 | 0 | 0 | 0 | 0 | 0 |
| Copulating | 0 | 0 | 0 | 0 | 0 | 0 | 0 | 0 | 0 | 0 | 0 | 0 |
| Display | 0 | 0 | 0 | 0 | 0 | 0 | 0 | 0 | 0 | 0 | 0 | 0 |
| Dependent young | 0 | 0 | 0 | 0 | 0 | 1 | 7 | 3 | 0 | 0 | 0 | 0 |
| Faecal sac | 0 | 0 | 0 | 0 | 0 | 0 | 0 | 0 | 0 | 0 | 0 | 0 |
| Inspecting hollow | 0 | 0 | 0 | 0 | 0 | 0 | 0 | 0 | 0 | 0 | 0 | 0 |
| Nest building | 0 | 0 | 1 | 7 | 8 | 1 | 0 | 0 | 0 | 0 | 0 | 0 |
| Nest with eggs | 0 | 0 | 0 | 1 | 1 | 0 | 0 | 0 | 0 | 0 | 0 | 0 |
| Nest with young | 0 | 0 | 0 | 0 | 1 | 1 | 1 | 0 | 0 | 0 | 0 | 0 |
| On/leaving nest | 0 | 0 | 1 | 6 | 4 | 0 | 0 | 0 | 0 | 0 | 0 | 0 |
Breeding records by year
Average number of breeding records per period by breeding code| Period | Breeding (BLA code) | Carrying Food | Copulating | Display | Dependent young | Faecal sac | Inspecting hollow | Nest building | Nest with eggs | Nest with young | On/leaving nest |
|---|---|---|---|---|---|---|---|---|---|---|---|
| All years | |||||||||||
| All | 0.0 | 0.1 | 0.0 | 0.0 | 0.3 | 0.0 | 0.0 | 0.5 | 0.1 | 0.1 | 0.3 |
| Previous years | |||||||||||
| All previous years | 0.0 | 0.1 | 0.0 | 0.0 | 0.2 | 0.0 | 0.0 | 0.5 | 0.1 | 0.1 | 0.3 |
| Previous 30 years | 0.0 | 0.1 | 0.0 | 0.0 | 0.2 | 0.0 | 0.0 | 0.5 | 0.1 | 0.1 | 0.3 |
| Previous 20 years | 0.0 | 0.1 | 0.0 | 0.0 | 0.1 | 0.0 | 0.0 | 0.5 | 0.0 | 0.1 | 0.3 |
| 10 year groups | |||||||||||
| [2007,2017) | 0.0 | 0.1 | 0.0 | 0.0 | 0.1 | 0.0 | 0.0 | 0.6 | 0.0 | 0.1 | 0.5 |
| [1997,2007) | 0.0 | 0.1 | 0.0 | 0.0 | 0.1 | 0.0 | 0.0 | 0.4 | 0.0 | 0.1 | 0.1 |
| [1987,1997) | 0.0 | 0.0 | 0.0 | 0.0 | 0.5 | 0.0 | 0.0 | 0.6 | 0.2 | 0.1 | 0.3 |
| 5 year groups | |||||||||||
| [2012,2017) | 0.0 | 0.2 | 0.0 | 0.0 | 0.2 | 0.0 | 0.0 | 0.6 | 0.0 | 0.2 | 0.8 |
| [2007,2012) | 0.0 | 0.0 | 0.0 | 0.0 | 0.0 | 0.0 | 0.0 | 0.6 | 0.0 | 0.0 | 0.2 |
| [2002,2007) | 0.0 | 0.0 | 0.0 | 0.0 | 0.0 | 0.0 | 0.0 | 0.6 | 0.0 | 0.0 | 0.0 |
| [1997,2002) | 0.0 | 0.2 | 0.0 | 0.0 | 0.2 | 0.0 | 0.0 | 0.2 | 0.0 | 0.2 | 0.2 |
| [1992,1997) | 0.0 | 0.0 | 0.0 | 0.0 | 0.2 | 0.0 | 0.0 | 0.6 | 0.0 | 0.0 | 0.6 |
| [1987,1992) | 0.0 | 0.0 | 0.0 | 0.0 | 0.8 | 0.0 | 0.0 | 0.6 | 0.4 | 0.2 | 0.0 |
| Year | |||||||||||
| 2017 | 0.0 | 0.0 | 0.0 | 0.0 | 4.0 | 0.0 | 0.0 | 1.0 | 0.0 | 0.0 | 2.0 |
| 2016 | 0.0 | 1.0 | 0.0 | 0.0 | 0.0 | 0.0 | 0.0 | 1.0 | 0.0 | 1.0 | 2.0 |
| 2015 | 0.0 | 0.0 | 0.0 | 0.0 | 1.0 | 0.0 | 0.0 | 1.0 | 0.0 | 0.0 | 1.0 |
| 2014 | 0.0 | 0.0 | 0.0 | 0.0 | 0.0 | 0.0 | 0.0 | 0.0 | 0.0 | 0.0 | 1.0 |
| 2013 | 0.0 | 0.0 | 0.0 | 0.0 | 0.0 | 0.0 | 0.0 | 1.0 | 0.0 | 0.0 | 0.0 |
| 2012 | 0.0 | 0.0 | 0.0 | 0.0 | 0.0 | 0.0 | 0.0 | 0.0 | 0.0 | 0.0 | 0.0 |
| 2011 | 0.0 | 0.0 | 0.0 | 0.0 | 0.0 | 0.0 | 0.0 | 1.0 | 0.0 | 0.0 | 0.0 |
| 2010 | 0.0 | 0.0 | 0.0 | 0.0 | 0.0 | 0.0 | 0.0 | 0.0 | 0.0 | 0.0 | 0.0 |
| 2009 | 0.0 | 0.0 | 0.0 | 0.0 | 0.0 | 0.0 | 0.0 | 0.0 | 0.0 | 0.0 | 0.0 |
| 2008 | 0.0 | 0.0 | 0.0 | 0.0 | 0.0 | 0.0 | 0.0 | 2.0 | 0.0 | 0.0 | 0.0 |
| 2007 | 0.0 | 0.0 | 0.0 | 0.0 | 0.0 | 0.0 | 0.0 | 0.0 | 0.0 | 0.0 | 1.0 |
| 2006 | 0.0 | 0.0 | 0.0 | 0.0 | 0.0 | 0.0 | 0.0 | 3.0 | 0.0 | 0.0 | 0.0 |
| 2005 | 0.0 | 0.0 | 0.0 | 0.0 | 0.0 | 0.0 | 0.0 | 0.0 | 0.0 | 0.0 | 0.0 |
| 2004 | 0.0 | 0.0 | 0.0 | 0.0 | 0.0 | 0.0 | 0.0 | 0.0 | 0.0 | 0.0 | 0.0 |
| 2003 | 0.0 | 0.0 | 0.0 | 0.0 | 0.0 | 0.0 | 0.0 | 0.0 | 0.0 | 0.0 | 0.0 |
| 2002 | 0.0 | 0.0 | 0.0 | 0.0 | 0.0 | 0.0 | 0.0 | 0.0 | 0.0 | 0.0 | 0.0 |
| 2001 | 0.0 | 0.0 | 0.0 | 0.0 | 1.0 | 0.0 | 0.0 | 0.0 | 0.0 | 0.0 | 0.0 |
| 2000 | 0.0 | 1.0 | 0.0 | 0.0 | 0.0 | 0.0 | 0.0 | 0.0 | 0.0 | 0.0 | 1.0 |
| 1999 | 0.0 | 0.0 | 0.0 | 0.0 | 0.0 | 0.0 | 0.0 | 0.0 | 0.0 | 0.0 | 0.0 |
| 1998 | 0.0 | 0.0 | 0.0 | 0.0 | 0.0 | 0.0 | 0.0 | 0.0 | 0.0 | 1.0 | 0.0 |
| 1997 | 0.0 | 0.0 | 0.0 | 0.0 | 0.0 | 0.0 | 0.0 | 1.0 | 0.0 | 0.0 | 0.0 |
| 1996 | 0.0 | 0.0 | 0.0 | 0.0 | 0.0 | 0.0 | 0.0 | 2.0 | 0.0 | 0.0 | 3.0 |
| 1995 | 0.0 | 0.0 | 0.0 | 0.0 | 0.0 | 0.0 | 0.0 | 0.0 | 0.0 | 0.0 | 0.0 |
| 1994 | 0.0 | 0.0 | 0.0 | 0.0 | 1.0 | 0.0 | 0.0 | 1.0 | 0.0 | 0.0 | 0.0 |
| 1993 | 0.0 | 0.0 | 0.0 | 0.0 | 0.0 | 0.0 | 0.0 | 0.0 | 0.0 | 0.0 | 0.0 |
| 1992 | 0.0 | 0.0 | 0.0 | 0.0 | 0.0 | 0.0 | 0.0 | 0.0 | 0.0 | 0.0 | 0.0 |
| 1991 | 0.0 | 0.0 | 0.0 | 0.0 | 0.0 | 0.0 | 0.0 | 0.0 | 0.0 | 0.0 | 0.0 |
| 1990 | 0.0 | 0.0 | 0.0 | 0.0 | 1.0 | 0.0 | 0.0 | 1.0 | 0.0 | 0.0 | 0.0 |
| 1989 | 0.0 | 0.0 | 0.0 | 0.0 | 0.0 | 0.0 | 0.0 | 1.0 | 0.0 | 0.0 | 0.0 |
| 1988 | 0.0 | 0.0 | 0.0 | 0.0 | 1.0 | 0.0 | 0.0 | 1.0 | 0.0 | 1.0 | 0.0 |
| 1987 | 0.0 | 0.0 | 0.0 | 0.0 | 2.0 | 0.0 | 0.0 | 0.0 | 2.0 | 0.0 | 0.0 |
| 1986 | 0.0 | 0.0 | 0.0 | 0.0 | 0.0 | 0.0 | 0.0 | 0.0 | 0.0 | 0.0 | 0.0 |
| 1985 | 0.0 | 0.0 | 0.0 | 0.0 | 0.0 | 0.0 | 0.0 | 0.0 | 0.0 | 0.0 | 0.0 |
| 1984 | 0.0 | 0.0 | 0.0 | 0.0 | 0.0 | 0.0 | 0.0 | 0.0 | 0.0 | 0.0 | 0.0 |
| 1983 | 0.0 | 0.0 | 0.0 | 0.0 | 0.0 | 0.0 | 0.0 | 0.0 | 0.0 | 0.0 | 0.0 |
| 1982 | 0.0 | 0.0 | 0.0 | 0.0 | 0.0 | 0.0 | 0.0 | 0.0 | 0.0 | 0.0 | 0.0 |
Distribution map
Distribution - 2017
This map shows the observed distribution of the Western Gerygone for 2017.
The red circles are the grid cells where Western Gerygone have been reported.
The transparency of the red circles indicate how many surveys sheets were submitted for that grid cell; the darker the red the more reliable the data. Of the 315 grid cells with reports, 83 had only one sheet; an example is grid number M6.
The size of the circle represents the reporting rate. The maximum reporting rate for Western Gerygone was 100.0% (eg grid number M6) and the minimum was 0.1% (eg grid number L14). 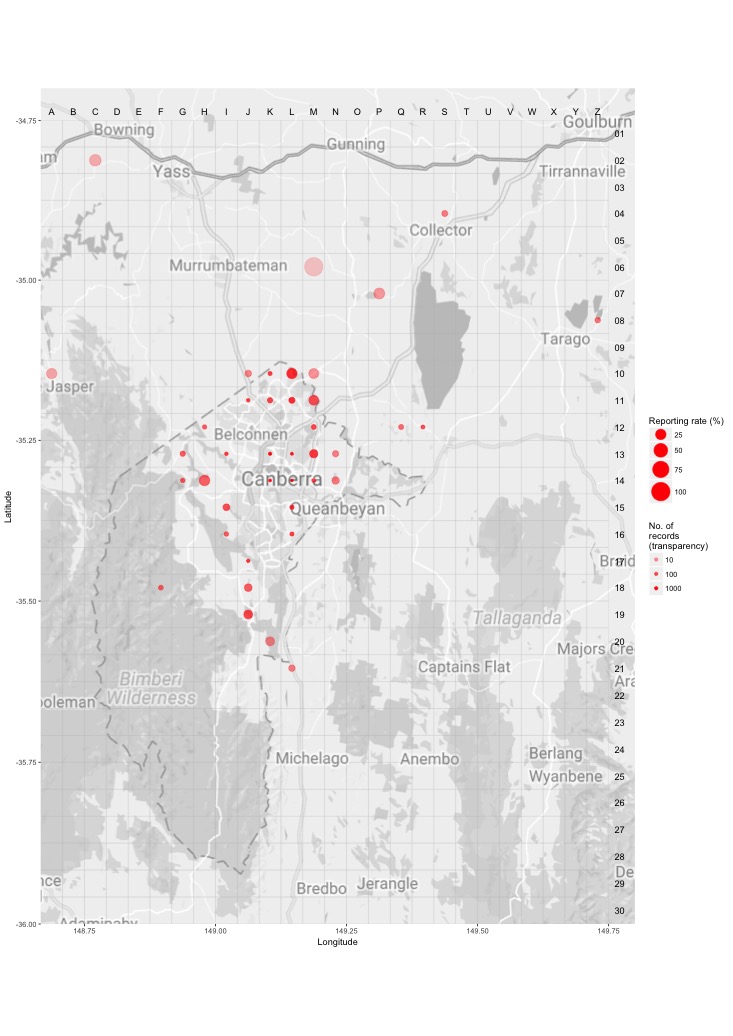
Distribution - all years
This map shows the observed distribution of the Western Gerygone for all years.
The red circles are the grid cells where Western Gerygone have been reported.
The transparency of the red circles indicate how many surveys sheets were submitted for that grid cell; the darker the red the more reliable the data. Of the 703 grid cells with reports, 55 had only one sheet; an example is grid number A12.
The size of the circle represents the reporting rate. The maximum reporting rate for Western Gerygone was 50.0% (eg grid number C3) and the minimum was 0.0% (eg grid number J14). 
Breeding map
Breeding - 2017
This map shows the breeding distribution of the Western Gerygone for 2017.
The red circles are the grid cells where breeding activity for Western Gerygone have been reported.
The size of the circle represents the number of reports. 
Breeding - all years
This map shows the breeding distribution of the Western Gerygone for all years.
The red circles are the grid cells where breeding activity for Western Gerygone have been reported.
The size of the circle represents the number of reports. 